
Instructional Roles - Is AI Shrinking Demand, Headcount or Both?

A studio of instructional designers, with a demand curve that rises and falls above them. Illustration generated with Midjourney.
Since Mid-2025: Federal Instructional-Systems Jobs Down 16.4%, UK Demand Down 21%, US Demand Down 9.5%
The question
In the past few weeks, instructional designers have started voicing their opinions on the importance of what they do, how they can't be replaced, and how AI is just another tool. I take that as an indication that at least some parts of the education and training industry may finally be feeling the impact of artificial intelligence. The question is where they go from here.
To understand what may be happening to the corporate training industry, look at the people who build it. Instructional designers and the roles around them sit upstream of the courses, the platforms and the vendors. If the industry is contracting, the numbers for those roles should show it first.
This piece looks for that evidence, and accepts only evidence that can be checked: government data and regulatory filings. That rules out most of what circulates. Job-board snapshots, layoff trackers, social posts and vendor surveys are someone's summary of the record, not the record.
I looked for data on instructional design and adjacent roles and found very little on privately held companies in the space. That suggests people in such roles are not enumerated in any visibly meaningful way in the corporate space. It could also be that their numbers are small compared with other professions. Some information can still be gauged from small samples, media reports and direct company disclosures as they are released. Media reports are not used here as evidence; company disclosures are. Employers that sponsor visa hires must file the role with the U.S. Department of Labor, so some data exists on training and L&D roles filled from overseas.
For government employment, the United States publishes counts by job series. The United Kingdom publishes online job advert counts by occupation. Neither has a category for instructional design itself, so the closest are used and named below. India has a national standard for the role: the Management & Entrepreneurship and Professional Skills Council publishes a Qualification Pack for Instructional Designer (MEP/Q2901, NSQF level 6, version 5.0). No official series counting the role or demand for it was found. This piece uses the U.S. and U.K. data.
What was searched
No official category isolates instructional design, so each source was read through the closest labels it offers. This piece covers five instructional roles, each tied to the series that counts it:
- Instructional designer or instructional systems specialist. OPM series GS-1750 (Instructional Systems) in the U.S. federal service. India's national standard for the role is MEP/Q2901.
- General education and training specialist. OPM series GS-1701.
- Instructional coordinator. BLS occupation 25-9031.
- Training and development specialist. BLS occupation 13-1151.
- Vocational and industrial trainer. ONS occupation SOC 3574, in the UK.
Postings and payroll series that cover these roles only as part of wider groups are used as context and are labelled where they appear.
Federal agencies. Army, Air Force, Veterans Affairs, Health and Human Services and Education, in the U.S. Office of Personnel Management's Federal Workforce Data: series GS-1750 (Instructional Systems) and GS-1701 (General Education and Training). Thirty quarterly snapshots, Q1 2019 to Q2 2026.
Public companies. Amazon, Microsoft, Booz Allen Hamilton, Leidos and Accenture. Two kinds of record: Department of Labor labor-condition and PERM filings, where the job is named by title or occupation code (SOC 25-9031, with 13-1151 as an adjacent tier), and state layoff (WARN) notices.
Private companies. No filing exists to search. They are treated separately, later in this piece.
| Source | What it counts | Limit |
|---|---|---|
| OPM Federal Workforce Data | Filled federal positions by job series | Series are proxies; many designers sit in other series |
| DOL LCA and PERM disclosures | Certified visa-sponsored and green-card roles | Sponsored hiring only; not headcount |
| State WARN notices | Employees named in layoff notices | All roles, no job titles; California and Maryland only |
What the data shows
Federal: steady roles, then a sharp fall. At the five agencies, filled GS-1750 (Instructional Systems) positions were 1,272 in December 2020 and 1,203 in June 2025, a drop of 5% in four and a half years. By July 2026 they were 1,006, which is 21% below December 2020. Of the 266 positions lost, 197 (74%) went after June 2025. GS-1701 (General Education and Training) follows the same shape: 4,746, then 4,517, then 3,908, down 18% overall.
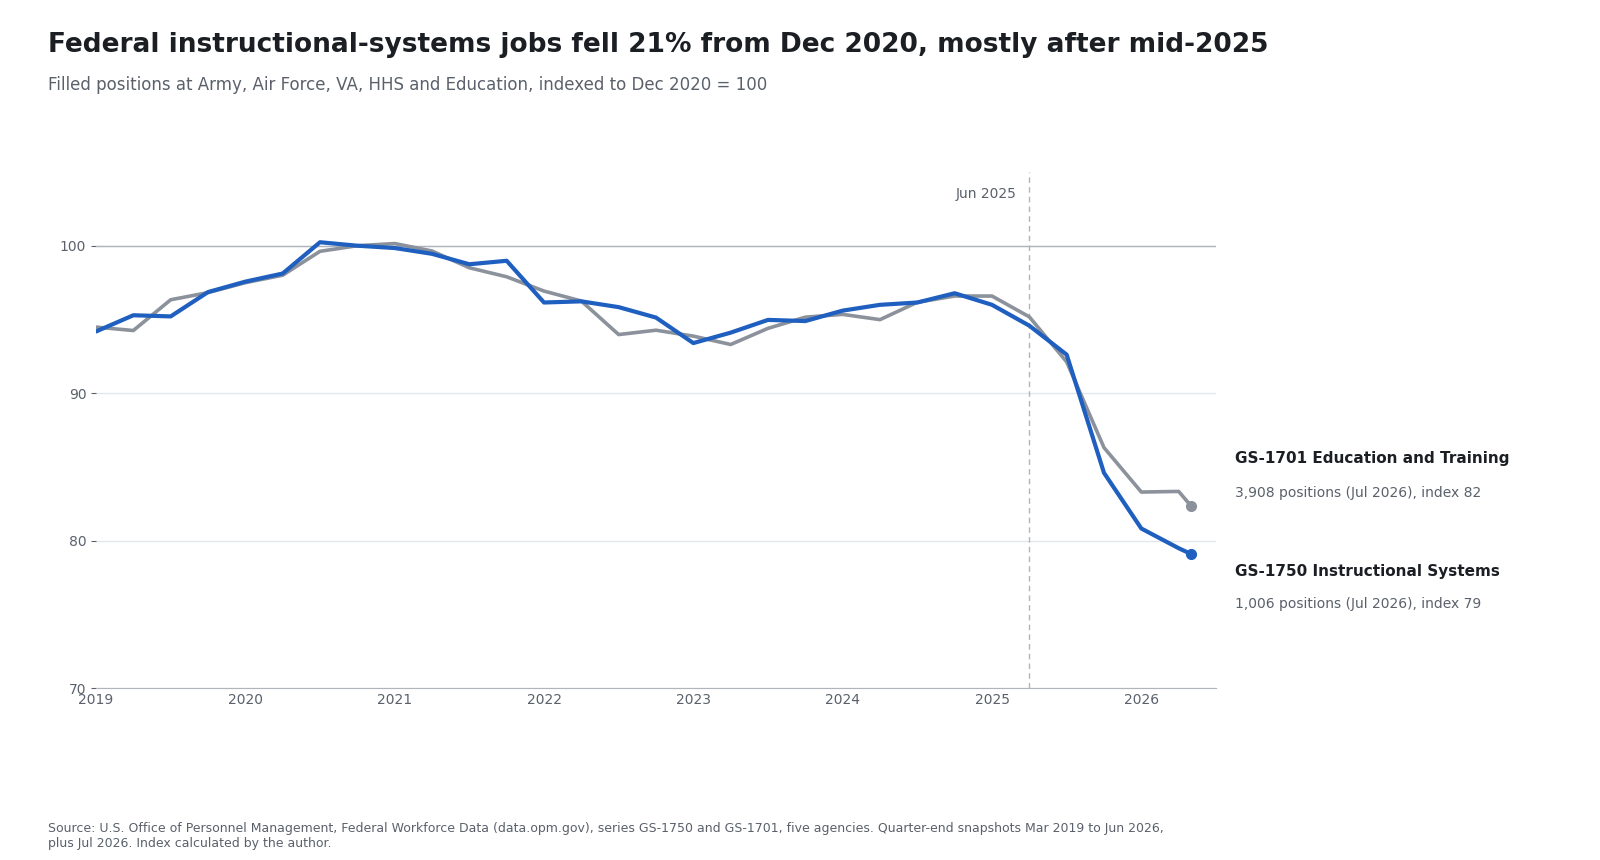
Source: OPM Federal Workforce Data (data.opm.gov), series GS-1750 and GS-1701, Army, Air Force, VA, HHS and Education. Quarter-end snapshots Mar 2019 to Jun 2026, plus Jul 2026.
The shares above are calculated from OPM counts. The five-agency workforce across all jobs was 937,958 in December 2020, 940,487 in June 2025 and 859,084 in July 2026: flat, then down 8.7%. The instructional-systems series fell about twice as fast as the agencies that employ it.
| Agency | GS-1750, Dec 2020 | GS-1750, Jun 2025 | GS-1750, Jul 2026 | GS-1750 change since Jun 2025 | Whole-agency workforce change since Jun 2025 |
|---|---|---|---|---|---|
| Army | 500 | 463 | 362 | -21.8% | -13.9% |
| Air Force | 673 | 654 | 575 | -12.1% | -10.6% |
| Veterans Affairs | 69 | 61 | 53 | -13.1% | -4.2% |
| Health and Human Services | 25 | 22 | 15 | -31.8% | -14.8% |
| Education | 5 | 3 | 1 | counts too small | -37.3% |
| Five agencies | 1,272 | 1,203 | 1,006 | -16.4% | -8.7% |
At the Air Force, instructional systems tracked the agency. At Army, it fell faster than the agency did. VA and HHS also show larger falls for the role than for the workforce, but on counts of 53 and 15 positions, a few departures move the percentage. Army and Air Force account for 236 of the 266 positions lost since December 2020.
Against the wider labour market
Three other series cover the same years. None isolates instructional design, and the last two do not show agencies at all.
- Job demand (Indeed Hiring Lab). The U.S. "Education & Instruction" postings index, total postings, end-of-quarter values, February 2020 = 100: 100.3 in March 2021, a peak of 162.9 in September 2022, 128.1 in June 2025, 115.9 in June 2026 and 107.3 on 25 September 2026, with the quarter still in progress. The June 2026 value is 9.5% below June 2025 (the author's calculation). The sector is broad and is not instructional design.
- Payrolls in the corporate training industry (BLS QCEW, NAICS 611430, Professional and Management Development Training). Private employees averaged 45,772 in the first quarter of 2019, peaked at 56,944 in the first quarter of 2025 and were 56,200 in the first quarter of 2026, the latest quarter published. That is 1.3% below the peak. Establishments rose from 8,570 to 16,159 over the same period. Quarterly averages are calculated from the three monthly figures.
- Occupational employment (BLS OEWS, May each year). Wage-and-salary employment is still rising at the latest reading, May 2025, which falls before the federal drop began.
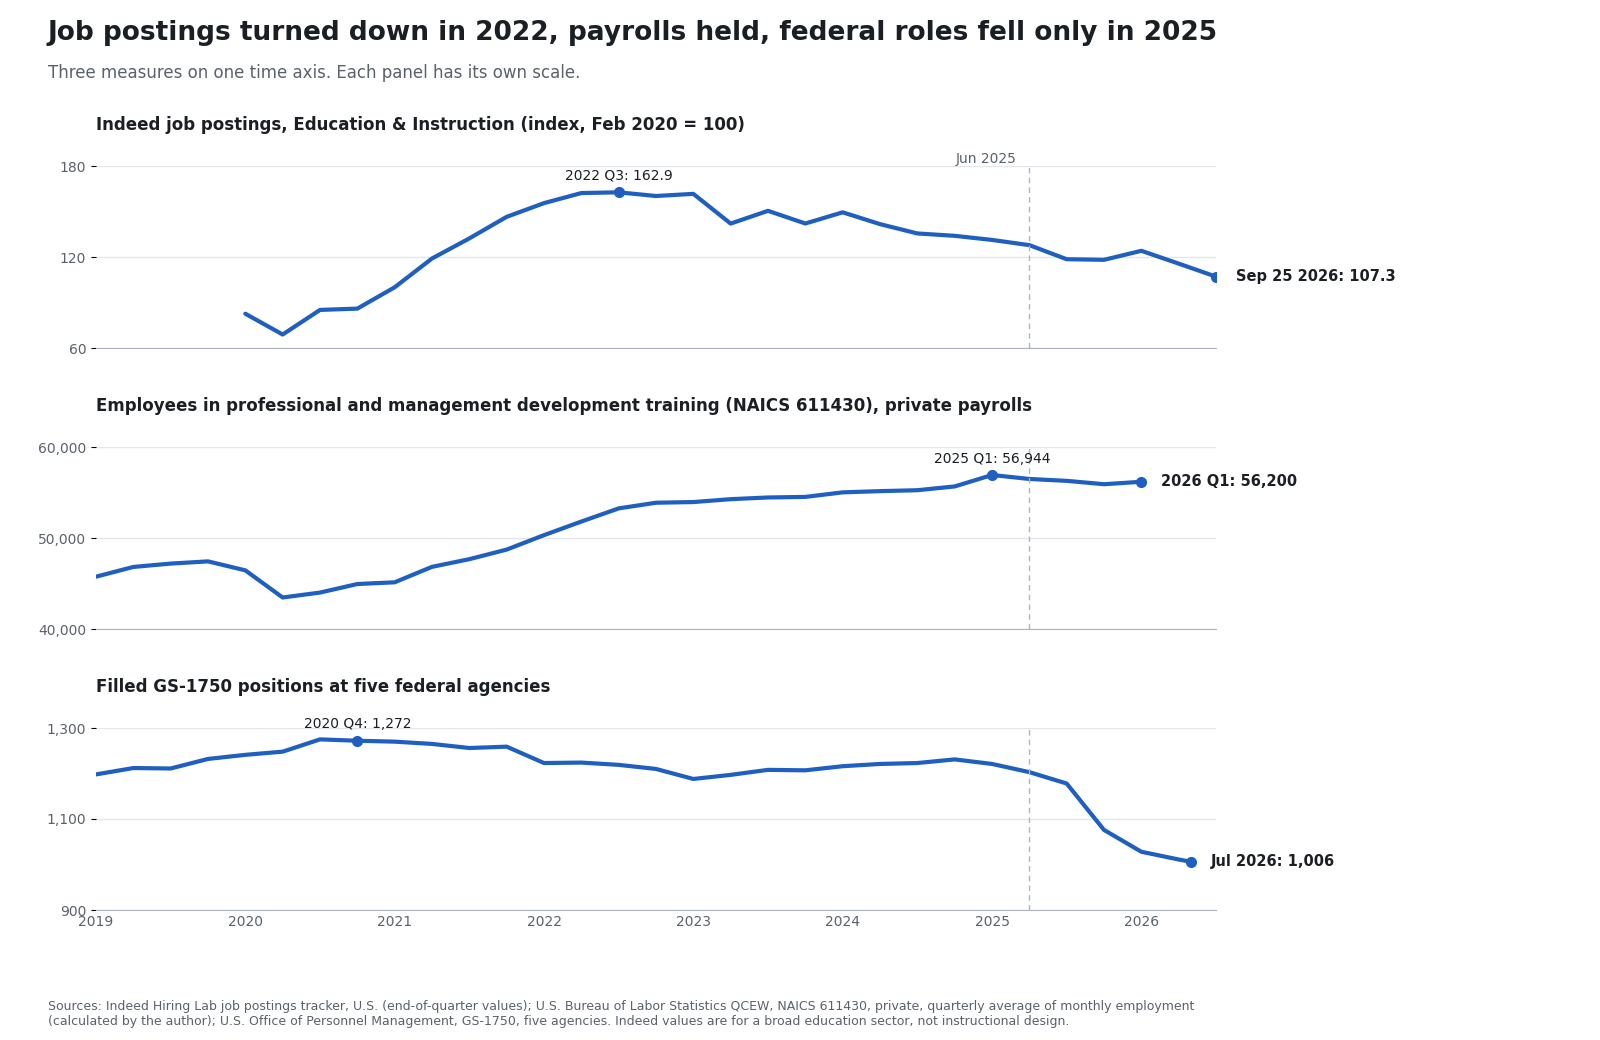
Sources: Indeed Hiring Lab job postings tracker (end-of-quarter values); BLS QCEW, NAICS 611430, U.S. private, quarterly average of monthly employment; OPM Federal Workforce Data, GS-1750, five agencies.
| May | Instructional Coordinators (25-9031) | Change | Training and Development Specialists (13-1151) | Change |
|---|---|---|---|---|
| 2021 | 184,740 | 336,030 | ||
| 2022 | 198,660 | +7.5% | 367,180 | +9.3% |
| 2023 | 207,270 | +4.3% | 403,480 | +9.9% |
| 2024 | 210,850 | +1.7% | 436,610 | +8.2% |
| 2025 | 227,760 | +8.0% | 458,300 | +5.0% |
OEWS excludes the self-employed, so its counts are lower than the job counts in BLS's Occupational Outlook Handbook, which use a wider base. BLS publishes no monthly or quarterly employment by occupation, and the May 2026 OEWS reading is not expected before 2027.
UK and India
UK. Two series can be checked. Indeed's UK "Education & Instruction" postings index, total postings, end-of-quarter, February 2020 = 100, was 105.6 in March 2021, 257.6 in December 2022, 141.5 in June 2025 and 112.4 in June 2026, with 122.8 on 25 September 2026. The June 2026 value is 21% below June 2025 (the author's calculation). The Office for National Statistics publishes new online job adverts from Textkernel by four-digit occupation. For SOC 3574, Other vocational and industrial trainers, the monthly average was 9,748 in 2019, 11,841 in 2022 and 6,858 in 2024. All occupations fell from 1,148,369 to 692,692 over the same two years. That is 42% for trainer adverts against 40% for the whole market, calculated by the author. The author's reading is that UK demand for this work rose and fell with the market and shows no role-specific collapse. ONS reports that a large source dropped out of its supply in June 2025 and that Textkernel's method changes can cause step changes, so no comparison is made across that month. These are adverts, not employment, and no UK series counts instructional designers.
India. India defines the role but no official count of it was found. The Management & Entrepreneurship and Professional Skills Council, a sector skill council, lists a Qualification Pack for Instructional Designer on its site (MEP/Q2901, NSQF level 6, version 5.0, 570 hours, next review 25 February 2027). No official series was found that counts instructional design, training or learning-and-development roles, or advert demand for them. The Periodic Labour Force Survey press note for 2025 reports employment by broad industry group and does not itemise education. The National Career Service reports vacancies as a running total, "more than 8.17 crore" to 20 November 2025, with no sector split. Commercial job-board indices for India were excluded under the same source standard. For India, this piece has a standard for the role and no count of it, so it reports no finding.
The headline, and what it could mean
Since mid-2025, federal instructional roles have shrunk faster than the workforce around them, and instructional systems about twice as fast.
The rest of this section is interpretation, written as analysis and not attributed to any source. Four readings fit the numbers. None is proven.
- A cut inside a larger cut. The five agencies lost 8.7% of their workforce after June 2025, and instructional systems fell with them. At the Air Force the two moved together. At Army, VA and HHS the role fell faster. The data cannot say whether positions were eliminated, left empty after departures or moved to other job series.
- Demand first, headcount later. Postings turned down in 2022 and are 34% below their U.S. peak. UK adverts for vocational and industrial trainers also peaked in 2022 and fell 42% by 2024, in step with the whole market (the author's calculation). Payroll employment in the training industry kept rising until early 2025, and national occupation counts were still rising in May 2025. That order is what a demand-led contraction would look like. It rests on one cycle, and the postings series is a broad education sector, not instructional design.
- AI substitution. The most discussed reading, and the one these data cannot test. No series here records why a role was not filled. The only direct evidence of intent is what employers say, covered in the next section.
- Fragmentation, not collapse. Training-industry payrolls plateaued, yet establishments rose 89% since 2019, from 8,570 to 16,159. More, smaller employers is consistent with work moving to small firms and independents. Payroll data does not count the self-employed, so this cannot be confirmed here.
Private employers: statements, not counts
No company examined here reports how many instructional designers it employs, and private companies have no duty to publish headcount. A search for reductions of instructional designers at private learning vendors returned no filing, regulator record or company statement. It returned vendor marketing pages, blog posts and tech-layoff aggregators, none of which meet the source standard of this piece.
What does exist is a thin record of what employers say, and of what filings show about whole workforces.
| Source | Type | What it says | What it cannot say |
|---|---|---|---|
| Amazon CEO memo, 17 June 2025 | Published by the company | "We will need fewer people doing some of the jobs that are being done today, and more people doing other types of jobs." It expects AI to "reduce our total corporate workforce" over the next few years. | Names no job family |
| Accenture results release, 25 September 2025 | Filed with the SEC | A six-month business optimization program of about $865 million, including "exiting people in a compressed timeline where reskilling is not a viable path for the skills it needs". It also expects its overall headcount to rise in fiscal 2026. | Names no skills or roles |
| Skillsoft annual reports (10-K), listed training vendor | Filed with the SEC | Total employees: 2,318 (Jan 2024), 2,261 (Jan 2025), 2,247 (Jan 2026) | All roles, not instructional design |
| U.S. Department of Labor visa and green-card filings | Regulator disclosure | Amazon's certified instructional-design and L&D positions: 99 in 2022, 9 in 2024, 17 in the first half of 2026. Booz Allen Hamilton and Leidos: none in any year. | Counts sponsored hires only. It cannot show whether the roles moved to U.S.-citizen hires or offshore. |
| Private learning vendors | None found | No filing or statement | Everything |
Every statement on this list concerns whole workforces or skills. None concerns instructional design. Employers with the most to say about AI and headcount say it in general terms and do not disclose which roles go. That silence is the reason the evidence for private employers is inference.
Media reports of internal memos and team cuts circulate widely in this field. They are not used here as evidence, because they cannot be checked against the memo or a filing. Where a company publishes the memo itself, as Amazon did, it is quoted directly.
What to expect
This section is the author's judgment, not a finding. The pattern so far is that demand weakened first and headcount followed. If that holds, the official counts will move toward the demand signal over the next few readings. Each expectation below comes with the result that would contradict it.
- Occupational employment (BLS OEWS, May 2026 reading, expected in 2027). The first official count taken after the federal drop. Expect growth to slow further or turn negative for both Instructional Coordinators and Training and Development Specialists. If both grow again at 2025's pace (8.0% and 5.0%), the demand-first reading is wrong.
- Training-industry payrolls (BLS QCEW, NAICS 611430). Expect employment to stay flat or drift lower while the number of establishments keeps rising. A sustained move above the first-quarter 2025 peak of 56,944 would contradict this.
- Federal GS-1750. Expect the level to settle near 1,000 unless agency workforces shrink further. The fall is already slowing: 1,076, 1,028, 1,011 and 1,006 across the last four snapshots (December 2025, March, June and July 2026).
- Private employers. Expect more statements like Amazon's and Accenture's and no disclosure of instructional-design numbers. Employer data will not settle this question. Job-function data from a source such as LinkedIn Talent Insights or Lightcast would.
How instructional roles can prepare
This section is the author's judgment, built on one practitioner's view of client work. It is not measured, and none of the sources above records it.
What the client work looks like. Over the past 12 months, client project workloads have fallen steadily. Where work exists, it has moved downstream, into production and build tasks, and not up into consultative work. The rest is internal preparation: proofs of concept and AI-enabled workflows that a team builds for itself. The work is also unevenly spread. A few instructional designers are heavily booked and many have little. The federal fall and the flat training-industry payrolls point the same way, but this is one observer's account and does not confirm them.
- Build the workflow, not only the deliverable. Internal proofs of concept are where the work is now. A designer who can design, run and document an AI-enabled workflow, from brief to reviewed output, is doing the work being commissioned. Build one end to end on your own material and keep it to show.
- Own the judgment the tools do not supply. Deciding what a learner must be able to do, whether an assessment measures it, and whether generated content is accurate and pitched right is review work. Make it a named step with criteria, not an unpaid part of production.
- Show results, not output. Spend is easier to defend when it is tied to a change in performance. On each project, even a small one, record the measure, the baseline and the result.
- Extend into adjacent roles that use the same skills. Learning analytics, enablement, customer education, performance support and learning operations are not tied to course production. The official counts for Instructional Coordinators and Training and Development Specialists were still rising to May 2025, and cannot say what has happened since. The next reading is due in 2027.
- Spread the risk while work is uneven. When work concentrates among a few people, being one of them matters more than being good in general. Stay in regular contact with the few buyers who commission work, take the design-stage and review work they keep, and do not depend on one client. Employees should find out which internal projects are running at their employer and get on them.
The checkpoints in the previous section test this advice. If the next OEWS reading and the quarterly payrolls hold up, the squeeze is narrower than this section assumes.
Sources and caveats
Sources
- U.S. Office of Personnel Management, Federal Workforce Data, employment files, series GS-1750 and GS-1701, snapshots March 2019 to July 2026
- Indeed Hiring Lab, job postings tracker, U.S. sector file, "Education & Instruction", total postings
- U.S. Bureau of Labor Statistics, Quarterly Census of Employment and Wages, NAICS 611430, private ownership, national, 2019 Q1 to 2026 Q1
- U.S. Bureau of Labor Statistics, Occupational Employment and Wage Statistics, national files, May 2021 to May 2025, occupations 25-9031 and 13-1151
- U.S. Department of Labor, Office of Foreign Labor Certification disclosure data, LCA and PERM, FY2020 to FY2026 Q3
- Amazon, Message from CEO Andy Jassy: Some thoughts on Generative AI, 17 June 2025
- Accenture, fourth-quarter and full-year fiscal 2025 results, 25 September 2025 (SEC exhibit)
- Skillsoft, annual reports on Form 10-K: fiscal 2024, fiscal 2025, fiscal 2026
- Indeed Hiring Lab, job postings tracker, UK sector file, "Education & Instruction", total postings
- Office for National Statistics, New online job adverts dataset by Textkernel, release of 17 September 2026, table 3 (four-digit SOC), SOC 3574 and all occupations
- Ministry of Statistics and Programme Implementation, India, Press note on the Periodic Labour Force Survey annual report, 2025
- Press Information Bureau, India, National Career Service portal
- Management & Entrepreneurship and Professional Skills Council, India, Training and assessment occupational standards, Instructional Designer, MEP/Q2901
Caveats
- The two federal series are proxies. Many instructional designers sit in other job series.
- Percentages, shares, quarterly averages and the comparison with whole-agency workforce are calculated from the published counts. They are the author's calculations, not figures published by the sources.
- Indeed values are end-of-quarter readings. The third quarter of 2026 runs to 25 September only. The sector is broad and is not instructional design.
- QCEW counts employees on payrolls and excludes the self-employed. 2026 Q1 is the latest quarter published.
- OEWS is annual, covers wage-and-salary employment and has no reading after May 2025.
- Visa filings count sponsored hires only, for fiscal years 2020 to the third quarter of 2026.
- Education's counts are between 1 and 5 positions and are not interpreted.